Accurate models that mathematically describe how tissue deformations are related to tissue stresses and how those relations change with time are a prerequisite to achieve useful in silico predictions. Due to its ultrasoft nature, brain tissue undergoes large deformations even under its own weight, and certainly during injury- or disease-relevant situations. Therefore, we develop models within the framework of finite deformation continuum mechanics. While one major drawback of previous models has been that they were based on poor, rather limited experimental data and could not capture the highly heterogeneous and dynamic nature of brain tissue, we develop mechanical models hand in hand with the versatile set of experiments. We aim to capture the complex and unique characteristics of this ultrasoft, heterogeneous, and active tissue through multi-scale and multi-physics approaches to couple tissue elasticity, viscosity, porosity, cell behavior (see Figure 1), and volume growth through appropriate constitutive and evolution laws. Like this, we aim to bridge the scales from microstructural changes on the cellular scale to the mechanical response on the continuum scale.
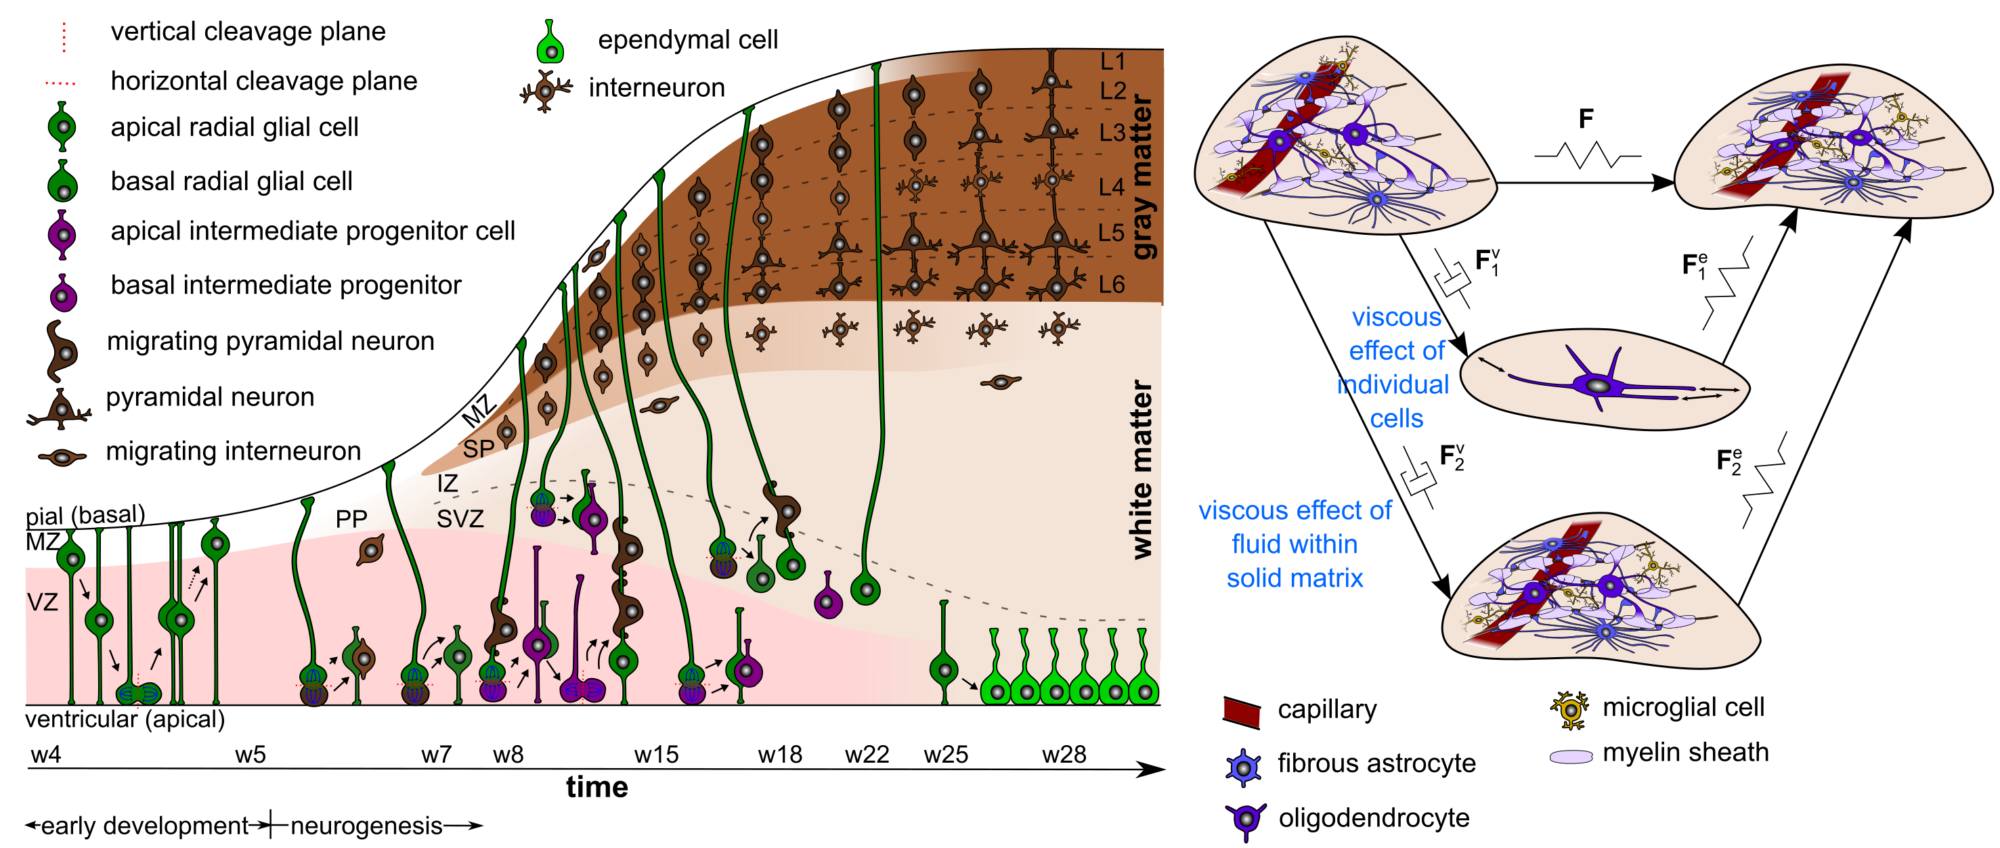
Figure 1: Microstructural origin of brain growth and brain tissue deformation.
Modeling brain development
To capture the interplay between cellular processes during brain development at the cell scale and cortical folding at the organ scale, we couple advection-diffusion equations with the theory of finite growth. The advection-diffusion equations allow us to model cellular division, migration, and neuronal connectivity and are coupled to the growth problem through the growth tensor that is driven by the density of brain cells, as indicated in Figure 2.
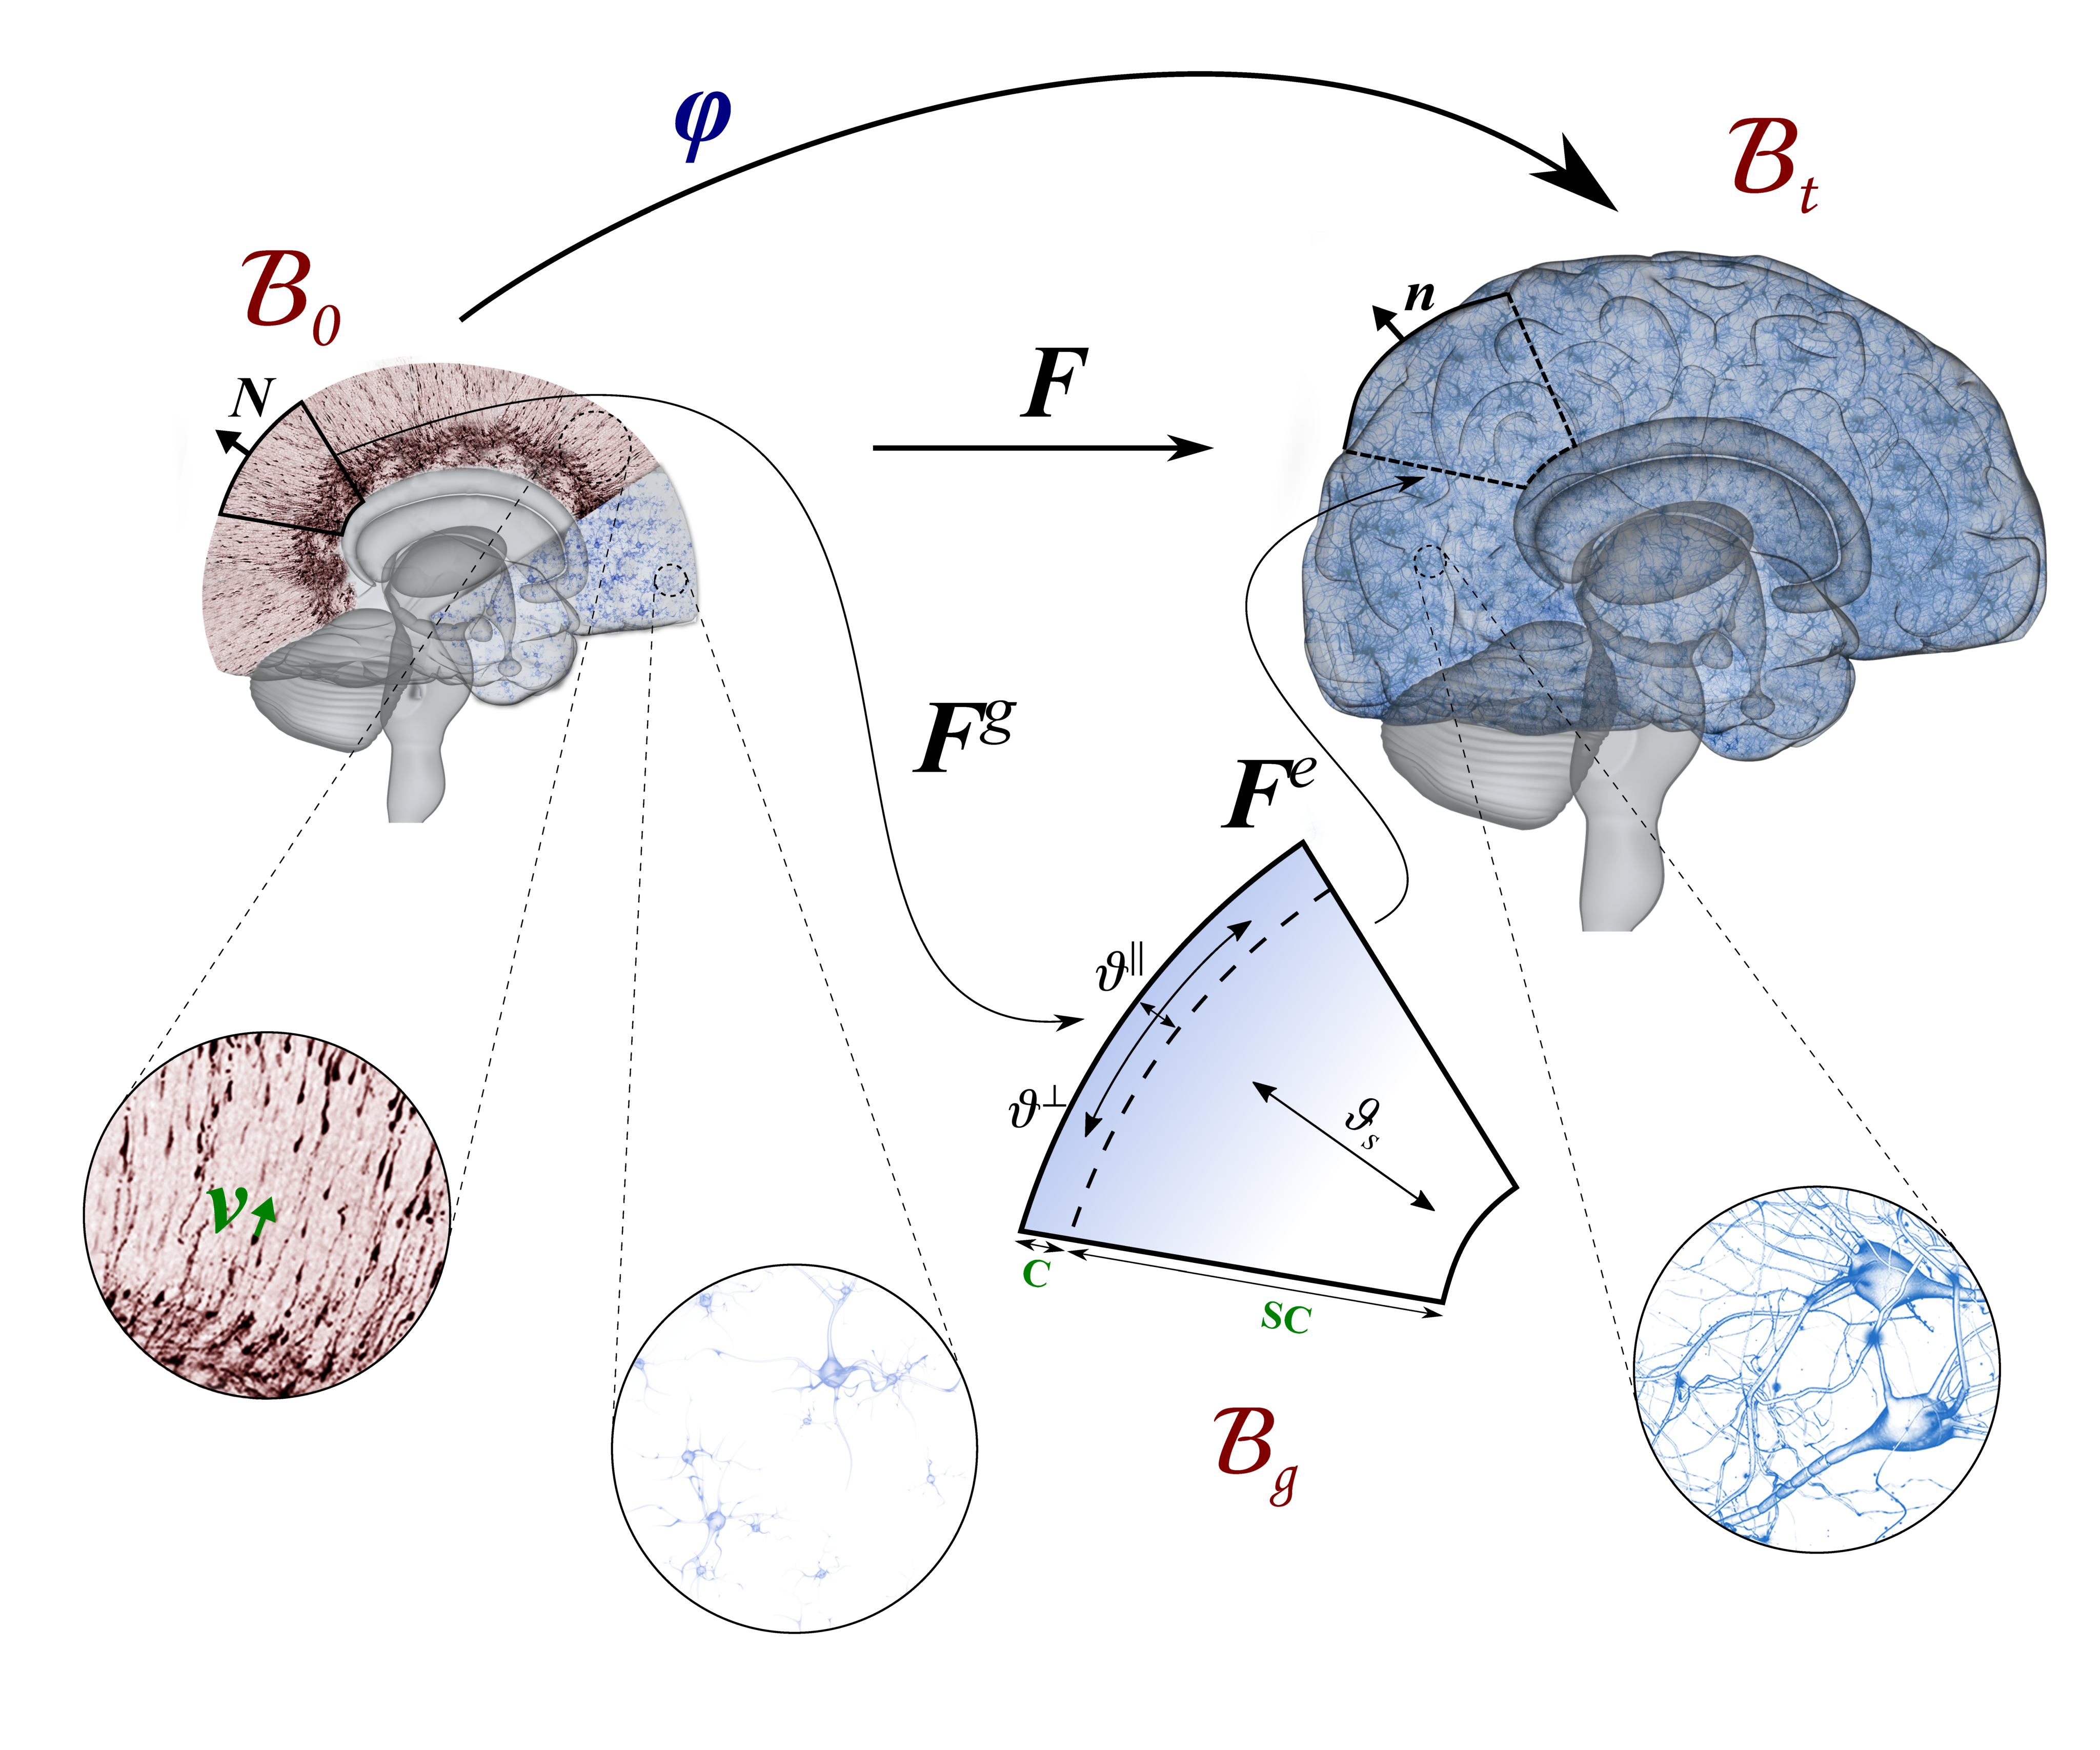
Figure 2: The reference configuration B0 represents the initial state of the brain at gestational week (GW) 11. The spatial configuration Bt represents the state of the brain at any time t during development. The stress-free (intermediate) growth configuration Bg is inserted between reference and spatial configurations.